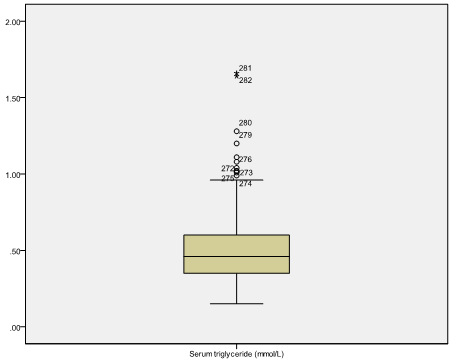
Question 4: Draw a box and whisker plot of the distribution.
The text is too small to read on screen.
Back to Exercise: Histogram of serum triglyceride data.
To Applied Biostatistics index.
To Martin Bland's M.Sc. index.
This page maintained by Martin Bland.
Last updated: 12 October, 2006.