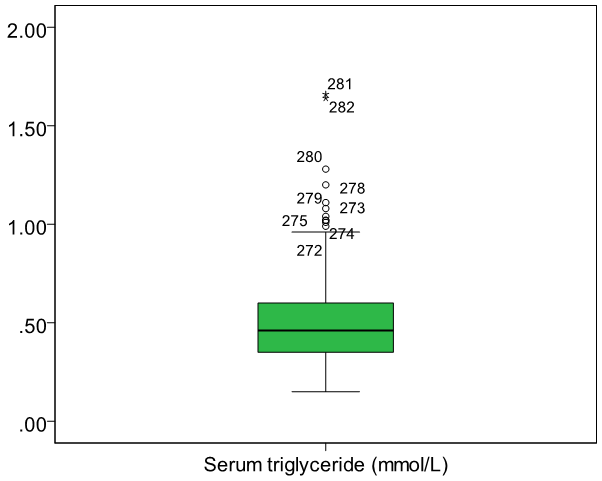
Question 5: Edit the box and whisker plot to increase the text size and change the colour.
I changed the main text size to 16 and the text size on the graph to 12.
Back to Exercise: Histogram of serum triglyceride data.
To Applied Biostatistics index.
To Martin Bland's M.Sc. index.
This page maintained by Martin Bland.
Last updated: 16 January, 2012.