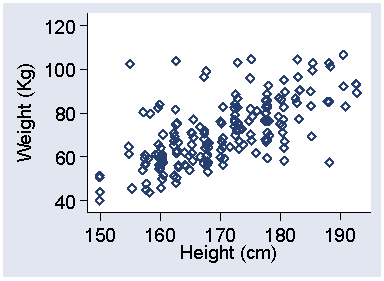
The following graph shows weight and height for the adult respondents to the 2005 M.Sc. questionnaire:

Question 1: What kind of graph is this?
Question 2. What would you guess the correlation coefficient to be for this graph?
Body mass index, also known as BMI, the ponderal index, and Quetelet's index, is said to be independent of height. The following graph shows BMI, calculated as weight in kilogrammes divided by height in metres squared, and height:
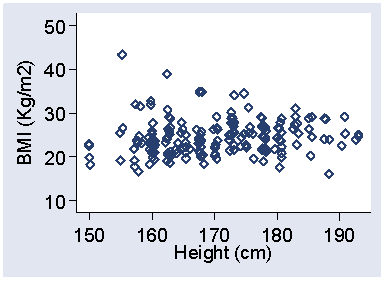
Question 3: What would you guess the correlation coefficient to be for BMI and height?
BMI is clearly much less dependent on height than is weight, so we will use it as a measure of the subject's bulk. The following graph shows the relationship between BMI and weekly alcohol consumption:
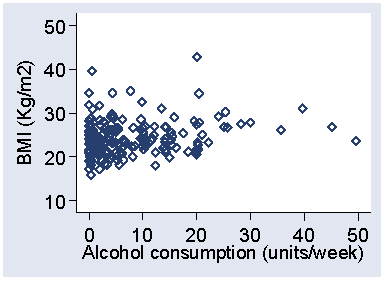
Question 4: Why would a correlation coefficient be difficult to interpret for this graph?
Instead, we could try linear regression. The following graph shows the linear regression of BMI on alcohol consumption:
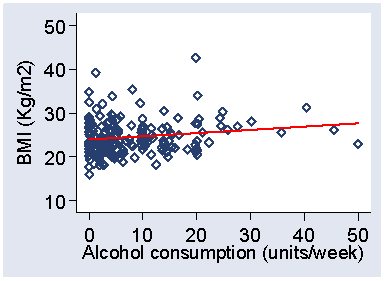
The regression equation is
BMI = 23.9 + 0.074 × alcohol per week
The following graphs show a histogram and a Normal plot for the residuals about this regression line:
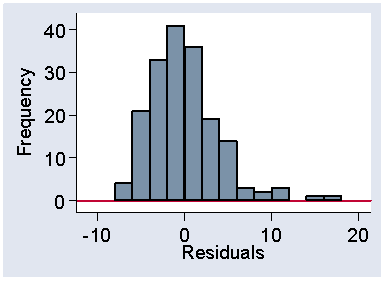
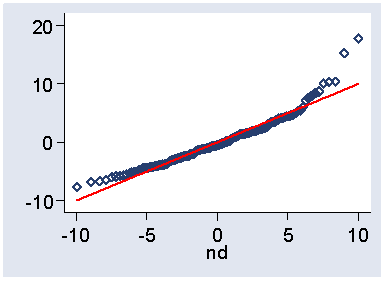
Question 6: What are residuals? What can we conclude about their distribution?
The following graph show a plot of the residuals againt height:
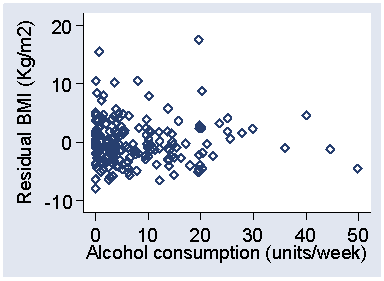
Question 7: What could we conclude from this graph?
The 95% confidence interval for the slope is 0.008 to 0.141 Kg/m2 per unit of alcohol per week and the P value = 0.028.
Question 8: What could we conclude from the confidence interval and P value?
Question 9: What other variable might have an influence on this relationship?
To Applied Biostatistics index.
To Martin Bland's M.Sc. index.
This page maintained by Martin Bland.
Last updated: 5 December, 2006.