This website is for students following the M.Sc. programme in Health Sciences at the University of York.
The following is the abstract of a paper:
Objectives: To assess the accuracy of point-of-care (POC) measurements of capillary blood [finger prick sample] glucose and glycosylated haemoglobin (HbA(1c)) levels in a remote Aboriginal community with high diabetes prevalence.
Design: Cross-sectional study comparing POC capillary glucose and HbA(1c) results with those from corresponding venous samples measured in a reference laboratory.
Participants and setting: 152 residents aged 11-76 years (representing 76% of population aged over 11 years) had POC glucose measurement in November 2003; 88 with POC glucose level >= 5.0 mmol/L, or self-reported diabetes, had POC HbA(1c) and laboratory glucose and HbA(1c) measurements.
Main outcome measures: POC fasting capillary levels of glucose (HemoCue Glucose 201 analyser, Medipac Scientific, Sydney) and HbA(1c) (DCA 2000+ analyser, Bayer Australia, Melbourne); correlation and mean difference between capillary POC and venous blood laboratory measurements of glucose and HbA(1c).
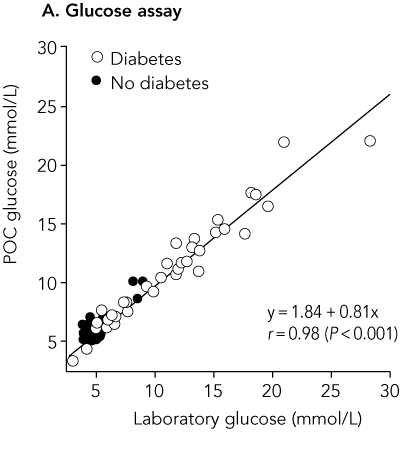
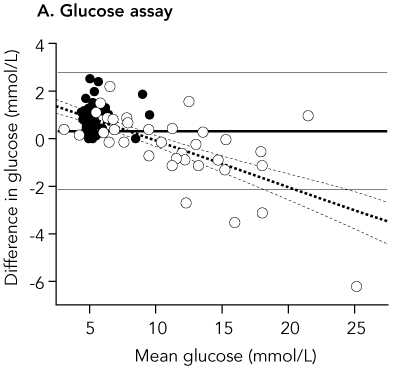
Results: Mean and median POC capillary glucose levels were 7.99 mmol/L and 6.25 mmol/L, respectively, while mean and median laboratory venous plasma glucose concentrations were 7.63 mmol/L and 5.35 mmol/L. Values for POC capillary HbA(1c) and laboratory HbA(1c) were identical: mean, 7.06%; and median, 6.0%, The correlation coefficient r for POC and laboratory results was 0.98 for glucose and 0.99 for HbA(1c). The mean difference in results was 0.36 mmol/L for glucose (95% Cl, 0.13-0.62; limits of agreement [LOA], -2.07 to 2.79 mmol/L; P = 0.007) and < 0.01% for HbA(1c) (95% Cl, -0.07% to 0.07%; LOA, -0.66% to 0.66%; P = 0.95), respectively.
Conclusion: POC capillary HbA(1c) testing, in particular, offers an accurate, practical, community-friendly way of monitoring diabetes in rural and remote clinical settings. POC capillary glucose results should be confirmed by a laboratory test of venous plasma if the results are likely to significantly influence clinical decisions.
(Source: Martin DD, Shephard MDS, Freeman H, Bulsara MK, Jones TW, Davis EA, Maguire GP. Point-of-care testing of HbA(1c) and blood glucose in a remote Aboriginal Australian community. Medical Journal of Australia 2005; 182: 524-527.)
The way the sample was drawn was as follows: All participants had POC measurement of fasting capillary glucose level. Those with a glucose level < 5.0 mmol/L (equivalent to fasting venous plasma glucose level < 5.5 mmol/L) were assumed not to have diabetes and not tested further (unless known to be taking medication for diabetes).
It is not clear from the abstract in which direction the limits of agreement have been calculated, but the mean difference +0.36 mmol/L quoted is for capillary glucose minus laboratory glucose. This is clear in the full paper. Hence the limits of agreement quoted are for capillary minus laboratory measurements of glucose and HbA1c.
The paper included the following figures:
Bivariate plot comparing point-of-care and laboratory results (n = 88)
Difference plot for point-of-care versus laboratory results
Back to Measurement in Health and Disease index.
This page maintained by Martin Bland.
Last updated: 1 March, 2007.