 d
d
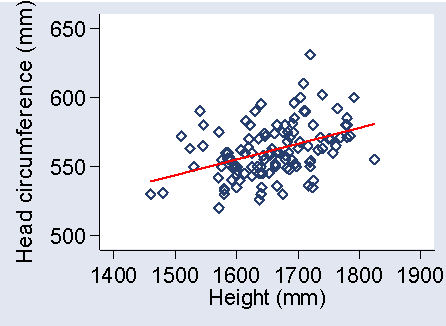
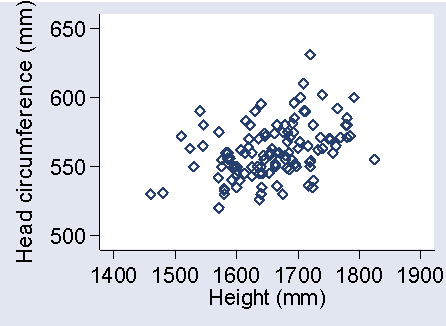
The following graph shows the relationship between head circumference and height in a sample of female healthcare students.
1. What kind of diagram is this?
2. How would you describe the strength of this relationship?
3. One of the statistics often calculated for data like these is a correlation coefficient, also known as Pearsons correlation coefficient or the product moment correlation coefficient, usually denoted by r. What does this tell us?
5. The significance test of the null hypothesis r = 0 in this population gave P < 0.0001. What does this mean and what precisely is it testing? How would you interpret the results of this test?
6. What conditions or assumptions do the data have to meet for this test to be valid? Do you think they are met here?
8. What conditions or assumptions do the data have to satisfy for this confidence interval to be valid? Do you think these data meet them?
9. The following graph shows the regression line for head circumference on height:
The equation of the regression line is:
head circumference = 372 + 0.114 × height
What is a regression line and what does it tell us? In what units are 0.114 and 372 reported?
10. The P value is P < 0.0001. What is this testing? What can we conclude from it?
11. What assumptions are required for this test? Do you think they are met here? What further information would you like to assess this?
12. Would we get a different P value if we carried out the regression of height on head circumference?
14. The 95% confidence interval for the slope of the line is 0.067 to 0.161 mm per mm. What does this mean and what can we conclude from it?
15. What assumptions do we require for the confidence interval to be valid? Are these different from those required for the confidence interval for the correlation coefficient?
To IAPT index.
To Martin Bland's M.Sc. index.
This page maintained by Martin Bland.
Last updated: 2 March, 2009.