In the exercise BMI and alcohol consumption in the 2005 questionnaire in Week 9, we saw that BMI was sigificantly positively related to alcohol consumption. The regression equation was
BMI = 23.9 + 0.074 × alcohol per week
The 95% confidence interval for the slope was 0.008 to 0.141 Kg/m2 per unit of alcohol per week and the P value = 0.028.
In that exercise, we commented that there may be other variables involved in this relationship, such as sex. In this exercise we look at the influence of sex on BMI.
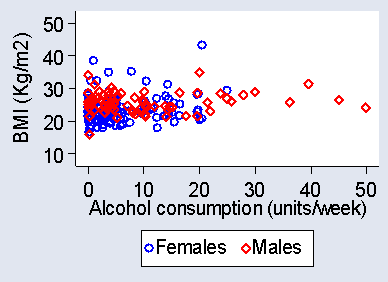
The following figure shows the relationship between BMI, alcohol consumption, and sex:

Question 1: What do you think the relationship is, based on this graph?
The multiple regression equation is:
BMI = 21.3 + 0.057 × alcohol consumption + 1.93 × sex
where sex = 1 for a female and sex = 2 for a male.
Question 2. How would you interpret this regression equation?
The confidence intervals and P values for the coefficients are:
| Term in equation | Coefficient | 95% CI | P |
|---|---|---|---|
| alcohol | 0.057 | -0.009 to 0.122 | 0.09 |
| gender | 1.93 | 0.76 to 3.10 | 0.001 |
| intercept | 21.3 | 19.5 to 23.0 | <0.001 |
To Applied Biostatistics index.
To Martin Bland's M.Sc. index.
This page maintained by Martin Bland.
Last updated: 8 December, 2006.