1.3. X-ray production#
X-rays can be produced by accelerating electrons at targets with a large number of protons (\(Z\)). The electrons emit a continuous spectrum of radiation (Bremsstrahlung) as they are slowed down and their kinetic energy is converted into x-ray photons. However, there is a minimum wavelength below which no x-rays are observed. Figure 1.8 shows a characteristic x-ray spectrum, the minimum wavelength cutoff is clearly seen where the x-ray intensity drops to zero at short wavelengths.
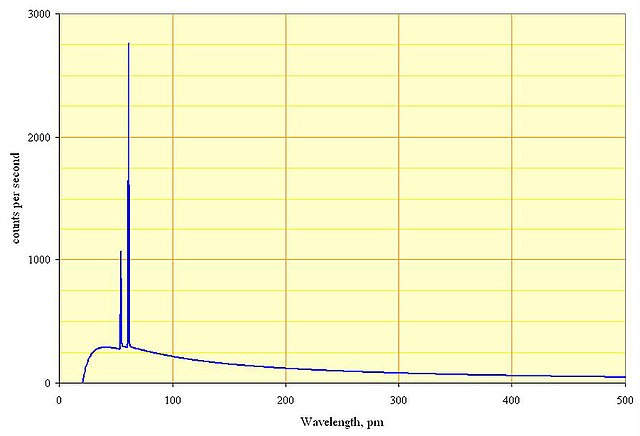
Fig. 1.8 A characteristic x-ray spectrum, the y-axis shows the intensity of x-rays and the x-axis show the wavelength. A cutoff is seen at short wavelengths where the intensity of the x-rays drops to zero. The two sharp peaks are related to the electron structure of the rhodium target used to slow the electrons. Electrons are ‘knocked out’ of their low orbits leaving a vacancy and electrons in higher energy orbit decay into the vacancy emitting an x-ray with energy determined by the energy difference between the two orbitals, these are called the K lines. The continuous background is due to bremsstrahlung radiation. (fig).#
For electrons accelerated through a potential \(V\) the maximum kinetic energy they can gain is given by \(qV\). Hence, when an electron gives up this energy to a single photon the maximum energy it can have is given by
Where \(f_\text{max}\) is the maximum allow photon frequency \(\lambda_\text{min}\) is the equivalent minimum allow wavelength. The process is equivalent to a reverse of the photoelectric effect.
The x ray tube used to produce the data in figure 1.8 was operated at 60 kV. Does equation (1.3) give the correct value for the minimum wavelength?
20.7 pm looks sufficiently close the the lower wavelength in the figure to say that this appears to be correct.
1.3.1. References#
(fig) LinguisticDemographer at English Wikipedia, Public domain, via Wikimedia Commons